Dashboard for Teradata DCM
Teradata is a cloud analytics and data platform application for Big Data in the Financial, Manufacturing, Retail, Healthcar, Governement and Telecom industries. The Demand Chain Management (DCM) application is an add-on to the Teradata Database that calculates and controls Demand Planning and Inventory Optimization at the SKU/Location for Retailers.
My Role
As the Product Manager Lead, I led 2 Product Managers and 3 cross-functional teams from concept to execution of the new Dashboard. I conducted user research via interviews and oversaw the new design closely with the UX designers.


The Product
The Demand Chain Management (DCM) application is an add-on to the Teradata Database that calculates and controls Demand Planning and Inventory Optimization at the SKU/Location for Retailers.
The process utilizes up to 4 years of actual Demand to create Sales profiles and assigns one model to each SKU. These Profiles represent the seasonality fo the items in the model by weekly weights - better known as Seasonal Factor. These weeks are not the actual sales but the related weight of each week versus the remainder 51 of the year.
From there, the system calculates an Average Rate of Sale (ARS) per week that adapts to each week's new Sales. The adaptation drives the average up or down based on user-defined policies.
The Forecast is calculated as the ARS multiplied by the week's Seasonal factor.
The Forecat is used to calculate the Replenishment Plan. The Plan calculates the required units to cover a future horizon, defined by the client, based on each Location/Vendor shipping calendar, each Location's available Stock, Vendor Lead times and Safety Stock.
The Process
The product had a great Forecast accuracy and could process millions of records and calculations during the night window. However, the UI had become slugish and outdated on an older tech stack.
Utilizing the feedback gathered during the previous year during our Customer Advisory Board we got to work on defining and designing a Dashboard that allowed users to obtain a snapshot of their Product Categories and identify trends and problem areas.
It took about 6 months to work through the mockups and validate these with a subset of customers that were interested in providing feedback during this process.
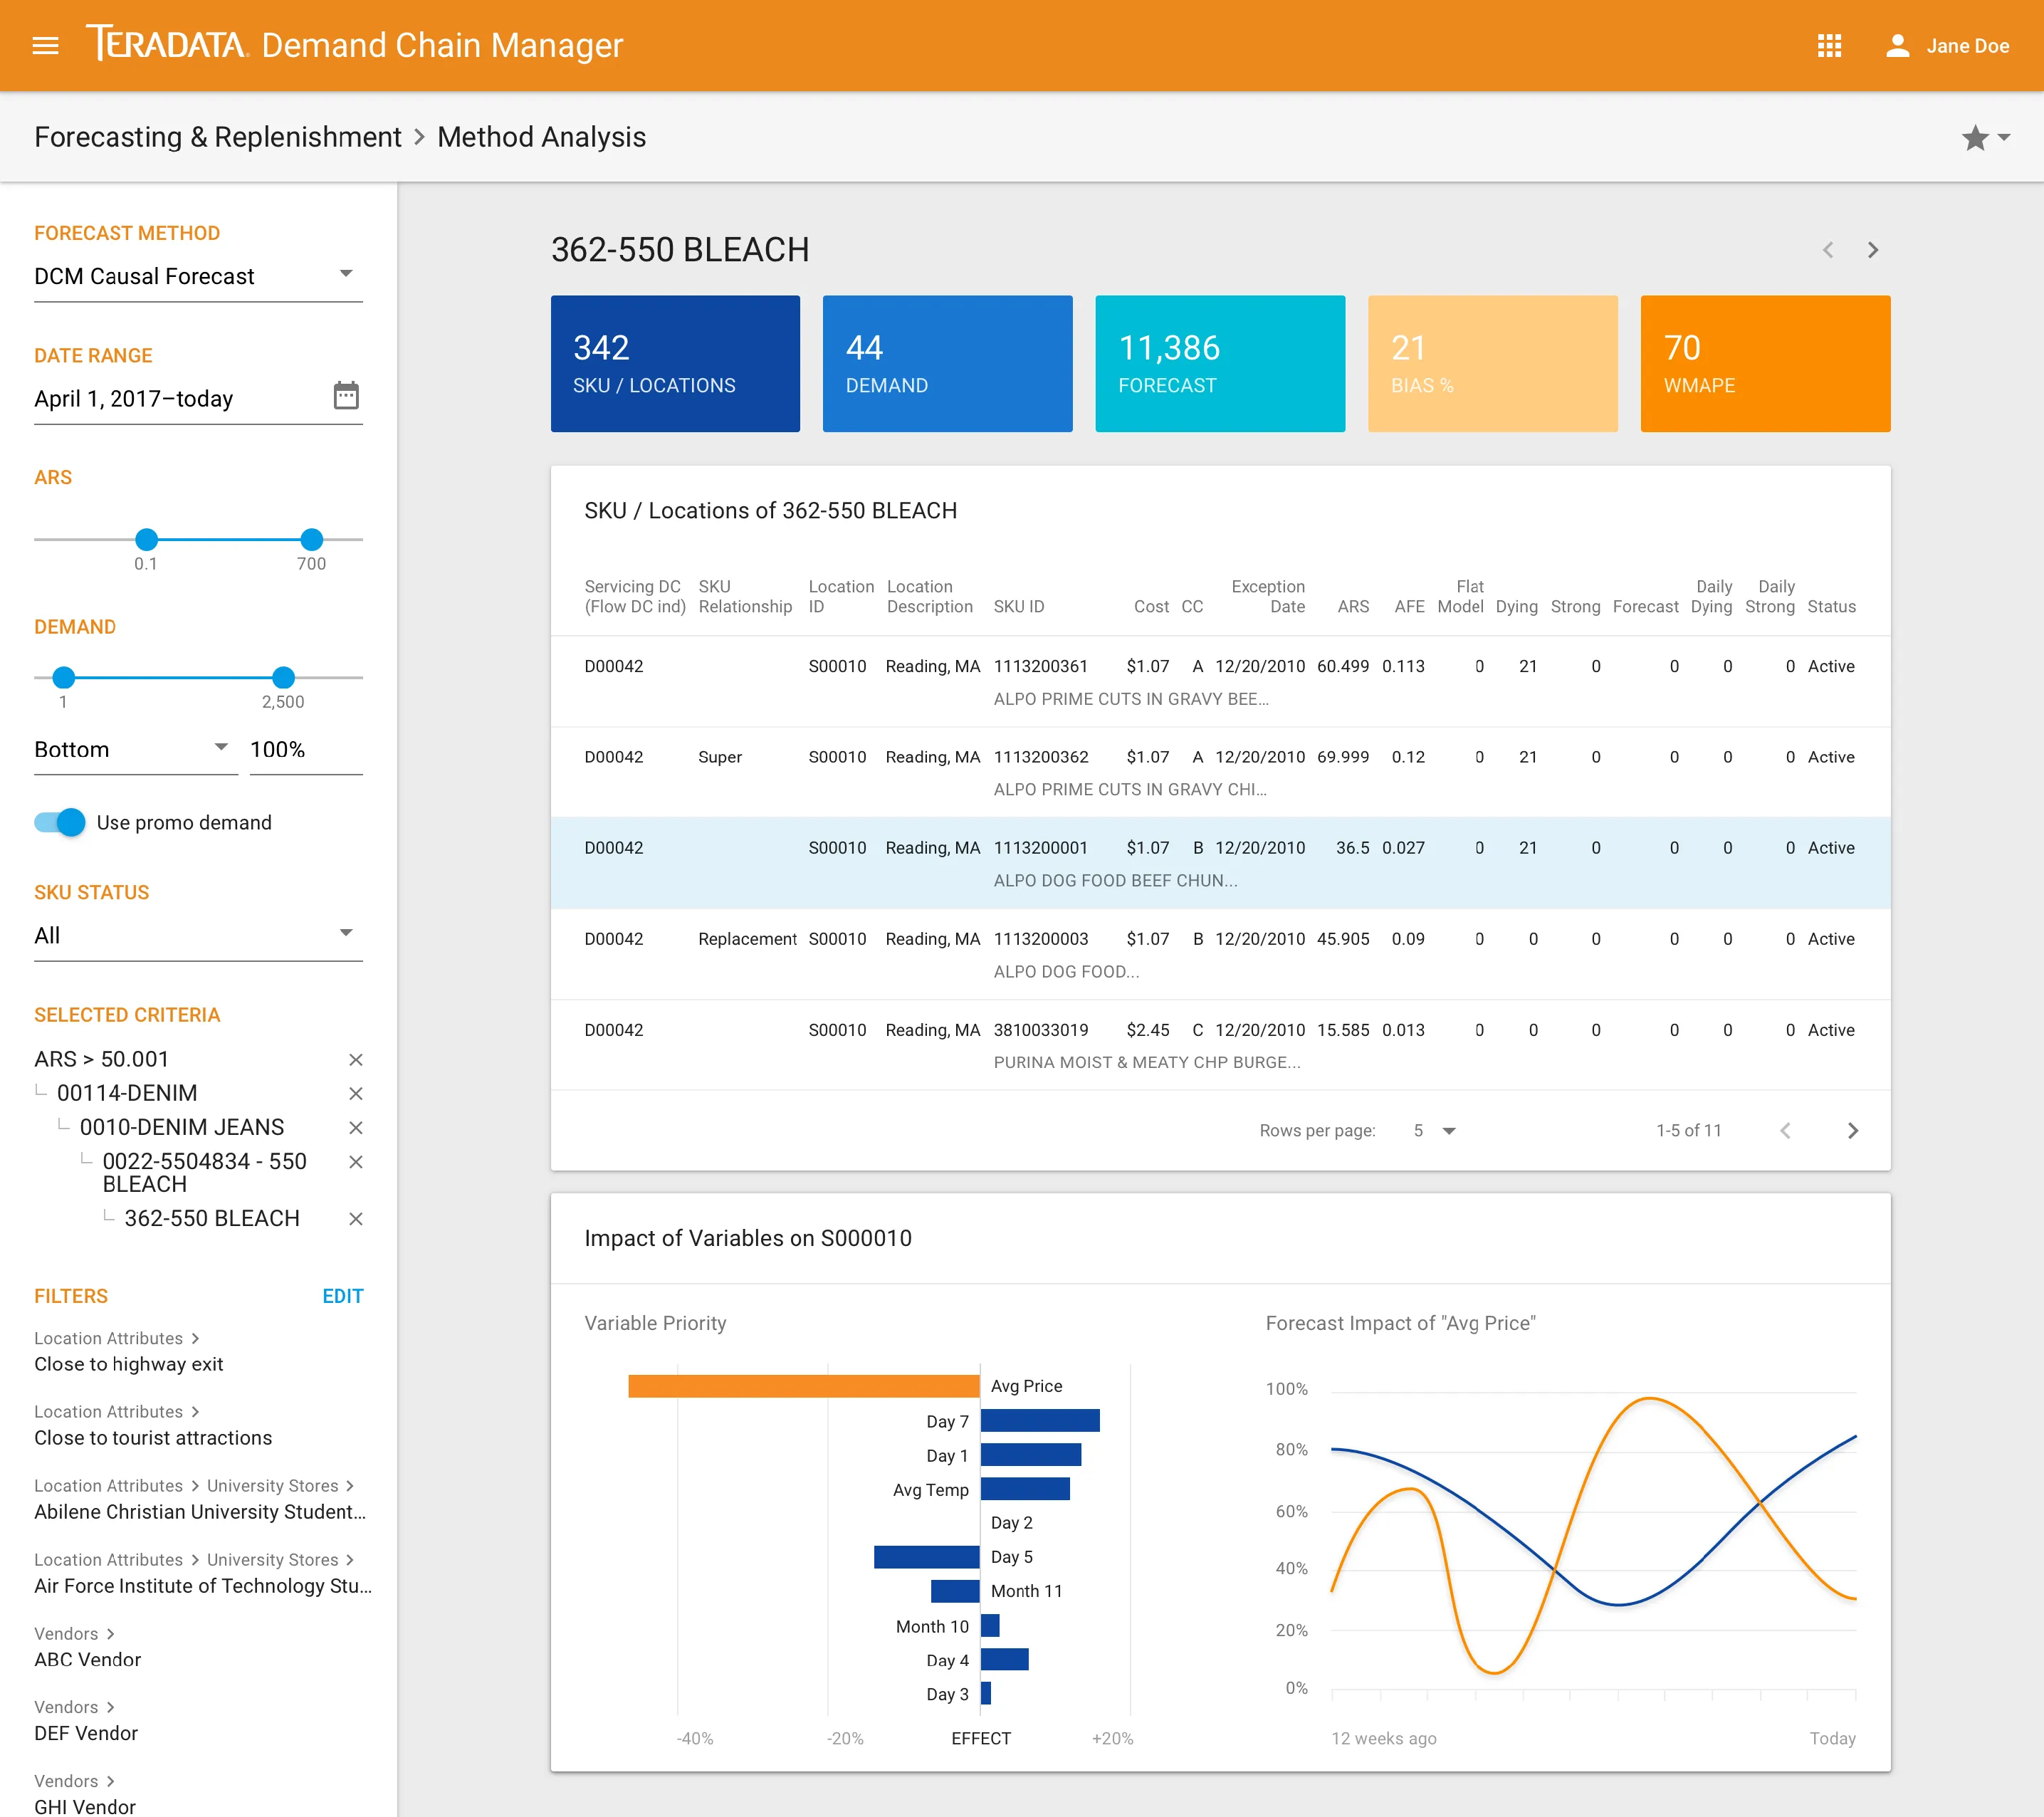
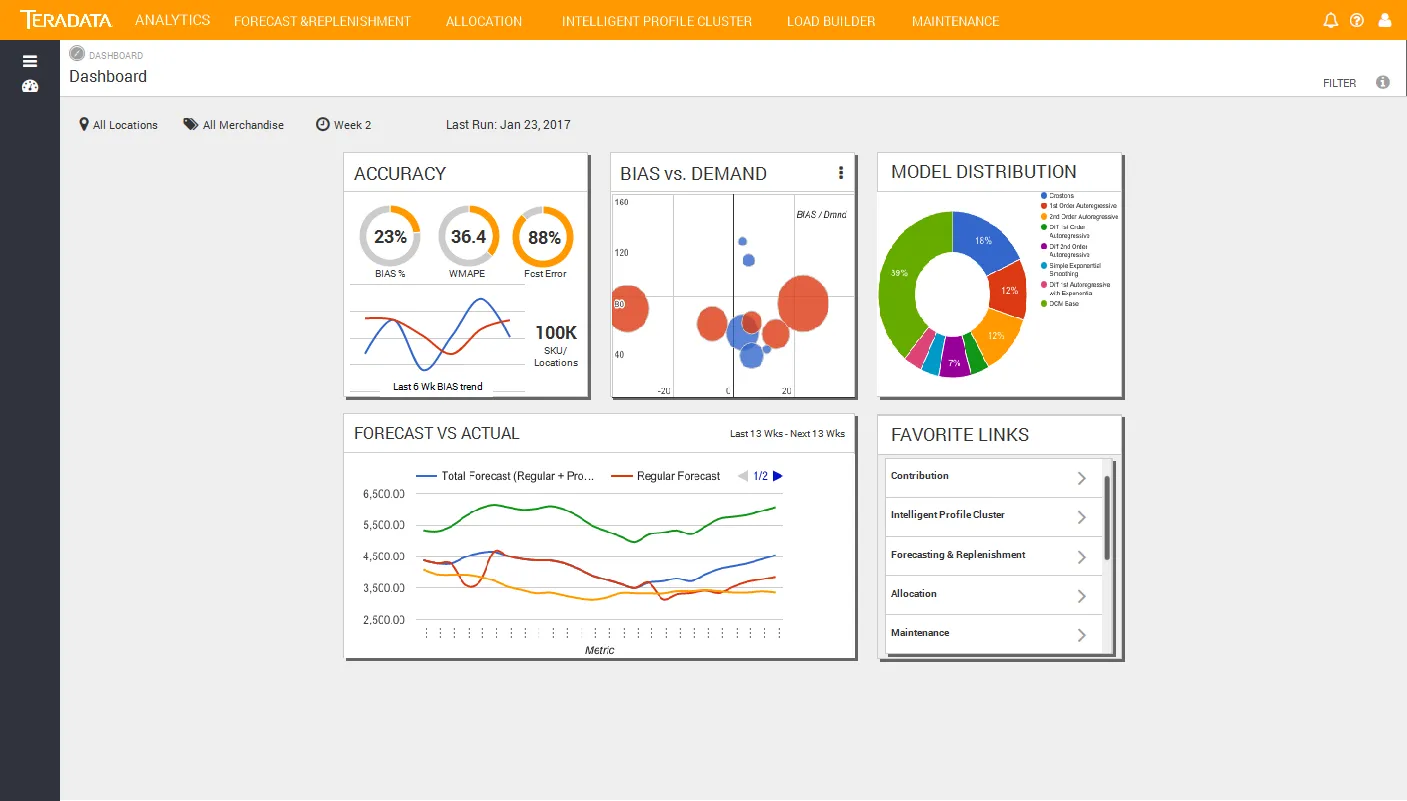
We were able to summarize the main information required by each persona to do their job effectively. For example, the images on this page show the Forecasting Dashboard. The rolled up data at the Category level (sometimes called Departments), provides a quick snap of the Accuracy, the trend, the mix of items and their rate of Sale.
The Dashboard also provide the ability to navigate to the analysis pages so that the Forecast Analyst can pinpoint the subcategories, classes and subclasses where the Forecast accuracy is less than ideal.


Metrics
Reduced the time spent looking for issues by 50%.
Processes over 60 million SKU/Locations.
Shows up to 6 weeks of history.
Users can create unlimited Favorites to navigate to specific reports at any time.
Key Takeaways
Customer Feedback drives the Process
Following the data really helps designing products that clients will actually use.
Some of the clients that use Teradata DCM


